The role of sales has evolved over the last decade, driven by technological and social changes. One major shift is the growth of the inside sales function, driven both by cost factors and the increasing importance of inbound leads, with the corresponding need for a higher volume of lead qualifications and conversions. It has inspired an entire new category of technological innovation referred to as Sales Engagement.
Despite the growing importance of inside sales and sales engagement, studies on how to drive lead conversion are few and far between and have tended to focus on individual variables affecting performance. This study, done in partnership with the Telfer School of Management from the University of Ottawa, aims to address the shortcomings by investigating how data-driven analytics can be used to analyze the interplay of relevant variables in the lead conversion process to identify actionable items that can be implemented by sales managers in the field.

The study adapts the Cross-Industry Standard Process for Data Mining (CRISP-DM) to analyze 130,000,000 interactions with 45,000,000 distinct contacts including 4,000,000 Web leads. It combines descriptive analytics, correlation statistics and logistic regression to understand and interpret how everyday selling variables - such as speed, contact attempts and experience – relate to each other and to sales outcomes. We focus on the outcome, and particularly the pursuit of positive or <win> outcomes, and the contribution of each sales variable to the outcome. These are preliminary study results, with the full study expected to be completed by the fall of 2018.
In many cases the preliminary results of the study confirm widely-held beliefs, but other findings are counter-intuitive. For speed-to-lead, or the first response time to a warm lead, it was confirmed that you should reach out within the first hour and that conversion rates drop considerably after 24 hours. However, the data shows that reaching out too quickly could have a negative impact: optimal response time was between 10 and 60 minutes from receiving the lead.
 Win outcomes were three times more likely when contact was made in the 10 to 60-minute time frame than in the first 10 minutes or after one hour. The number of contact attempts to reach a successful outcome is trending upwards over the years and is now at an average of six calls, but can vary significantly among industries. The day of the week and time of day have a relatively small impact on call results. Persistency, or follow-up, turns out to be one of the most important success factors. In fact, an analysis of call productivity – i.e. the number of calls per hour or per day of a salesperson – showed no direct impact on win outcomes.
Call productivity was highly correlated with persistency, however, which significantly increased the chance of a win outcome. Call volume is therefore still important, but its impact on outcomes may be more nuanced than currently thought and needs to be better understood by sales managers. Finally, as is to be expected, the experience of the salesperson increases their likelihood of success by influencing other variables such as speed-to-lead and persistency.
 A fundamental shift in the sales function involves the growing use of Inside salespeople (Järvinen & Taiminen, 2016; Rutherford, Marshall, & Park, 2014), to take advantage of modern technologies that reduce the need for traditional face-to-face interactions (Rutherford et al., 2014). Inside sales is growing both in importance and in size (Rutherford et al., 2014) with companies hiring inside salespeople at a much higher rate than outside salespeople. However, little is known about the types of activities that drive the success of inside salespeople (Ohiomah, Benyoucef, & Andreev, 2016; Rutherford et al., 2014).
Following-up on leads until qualification or conversion to sales is an essential part of the inside sales process (Pullins, Timonen, Kaski, & Holopainen, 2017; Zoltners, Sinha, & Lorimer, 2013), yet, effective lead follow-up still remains a serious issue for practitioners (Järvinen & Taiminen, 2016; Ohiomah et al., 2016; Sabnis, Chatterjee, Grewal, & Lilien, 2013; Smith, Gopalakrishna, & Chatterjee, 2006). On average, only 1-5% of all prospects will convert to sales. This is because existing approaches to lead management often rely on subjective intuition, expert suggestions and gut feeling. This reduces the chances of qualifying and converting leads to sales, and eventually hurts company revenue (Smith et al., 2006).
Existing studies on lead conversion have either suggested models to:
 Our review of the literature found three major problems with existing lead conversion models. First, to the best of our knowledge, no study has integrated these three aspects together to offer a wide-ranging lead conversion model. This offers a unique opportunity. We believe that prioritizing which lead to pursue, who should pursue the lead and how or when to engage with this lead is a three-way relationship with little to no trade-off among all sides. This represents a gap yet to be filled in the literature. Second, we are not aware of any academic research that has investigated lead conversion by looking at key variables of the lead engagement task itself.
Although factors such as time of call and contact attempts to lead are consistent and applicable to the majority of inside sales businesses, there is a dearth of academic research offering insights on the factors that may help improve lead conversion outcomes. Third, the majority of these studies do not usually rely on gathering and implementing data-driven insights (e.g., Monat, 2011). Data-driven analytics can provide insights on sales lead conversion activities, but to date, data driven approaches to inside sales are understudied. Our study aims to address these shortcomings by investigating how data-driven analytics can be used to improve lead conversion outcomes using call history logs collected from hundreds of inside sales companies representing different industries over a long time period.

The overall objective of this research is to develop a data-driven lead conversion model that incorporates key variables of an inside selling situation. Specifically, we seek to answer the following questions:
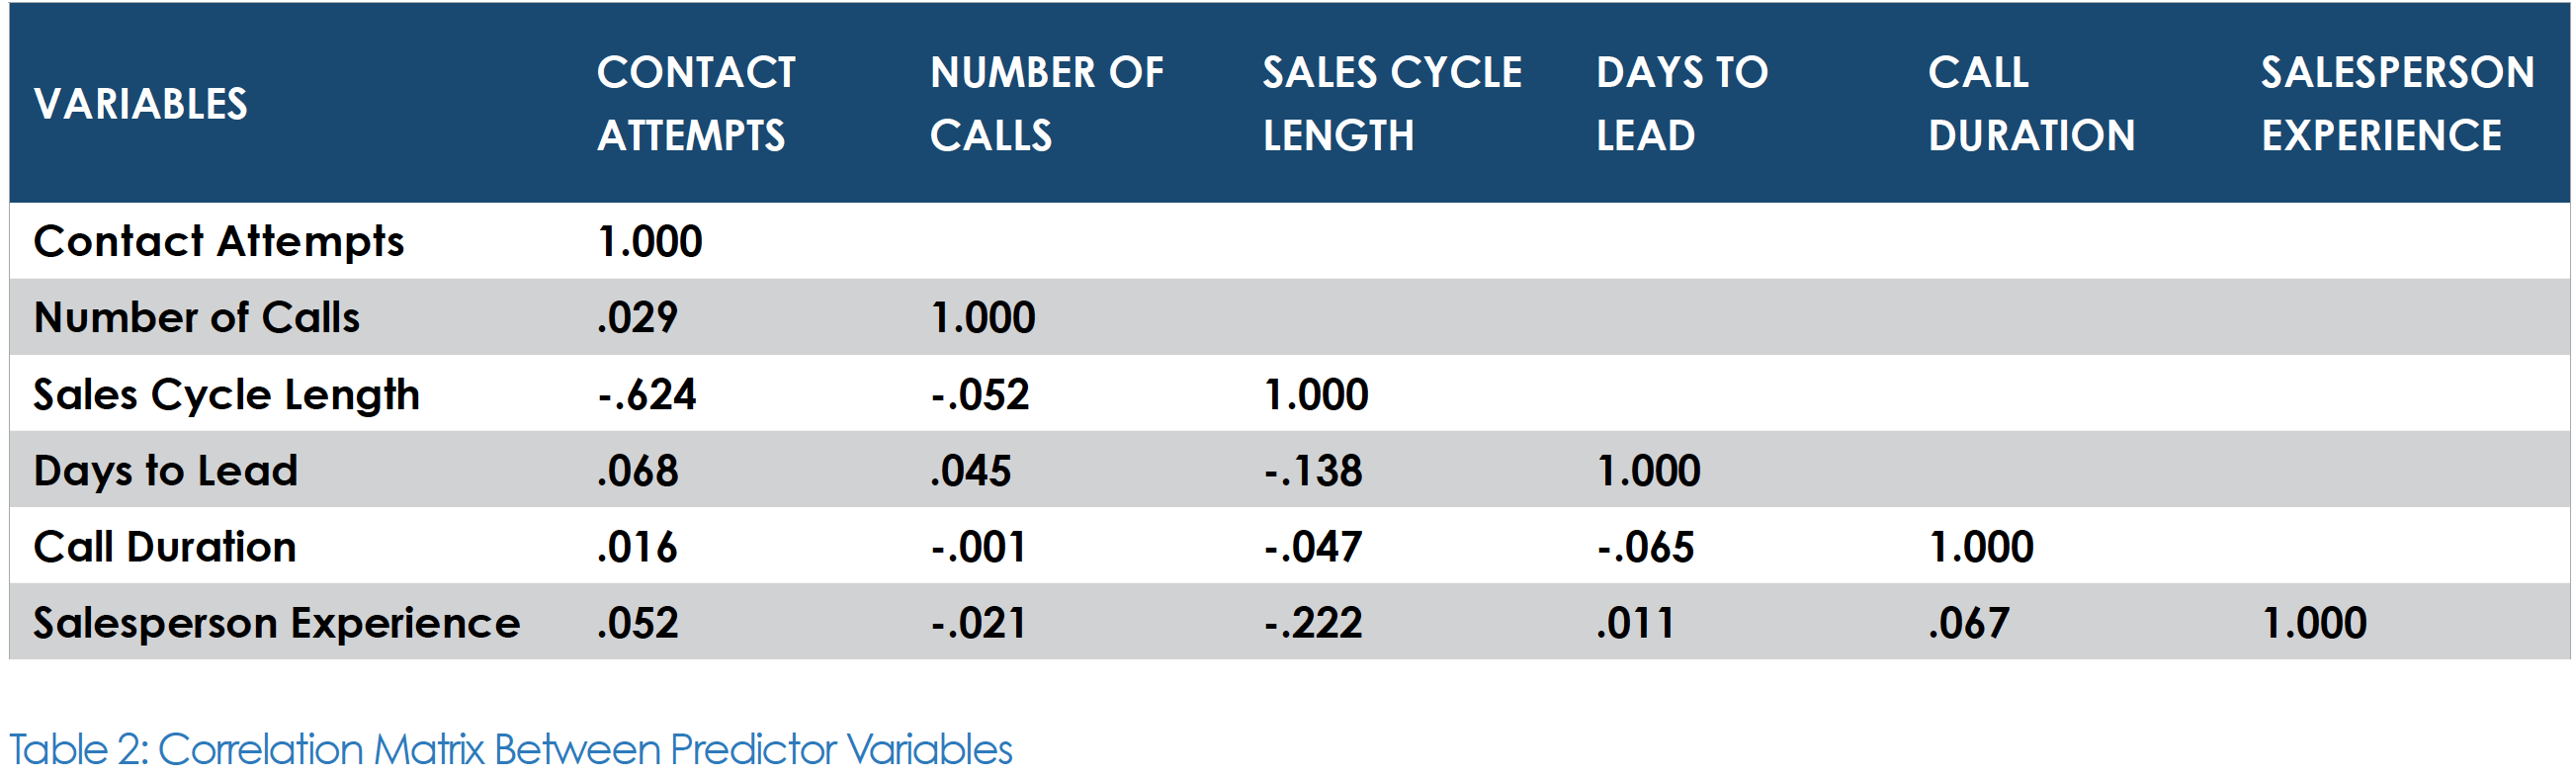
The design of this study adapts the Cross-Industry Standard Process for Data Mining (CRISP-DM) framework Chapman et al., (2000). First, we defined, collected and prepared the required data for our investigation. Then, we applied descriptive analytics by calculating central tendency measures of initially identified selling variables and plotted distributions to understand similarity and relationships between these variables. Additionally, we used correlation statistics and logistic regression to better understand and interpret how everyday selling variables (e.g., salespeople experience, contact attempts etc.) relate with each other and with sales outcomes, as well as their level of significance.
With the help of an industry-leading provider of sales engagement solutions, we collected over 220 million call interactions with over 70 million leads from 550 companies representing multiple industries. The data was generated from 2005 through 2017. The type of sales call carried out by inside salespeople within this data include: calling to qualify leads, calling to develop and manage leads (i.e. nurturing leads), calling for proposal or sales closing, calling to up-sell or cross-sell to existing customers, calling to build strong relationships with key customers, and calling for service and support.
This kind of data can help profile and segment leads, recognize the best time to contact leads, assess the impact of response time to lead, and identify best lead contact practices such as contact attempts needed to connect with a lead. To the best of our knowledge, no academic research on data of this magnitude has explored these range of variables generated by inside sales calling activity.
In this research, we define lead conversion outcome as the result from an interaction with a lead. This is different from response rate (i.e., time and effort a lead devotes to responding to a sales pitch via email or call) and cadence (i.e., sequence of scheduled contact attempts with leads via email, call and other communication channels).
We defined 3 main outcomes (Unknown, Loss and Win) from over 13,000 unique resulted call outcomes. These outcomes are consistent with Yan et al., (2015) conceptualization of sales outcomes. In the case of an Unknown outcome, contacts requested a call back, or the contact was not attempted, or the decision maker was not reached, or the phone line was disconnected or busy, or the contact information was wrong or incomplete or the business is a corporation and another person’s contact information was provided. An outcome is recorded as a Loss if the salesperson failed to qualify or convert the lead at any point in the sales process even after showing prior interest. While Win (i.e., Success) outcomes included qualified sales leads who showed interest, and or requested or booked appointments and demos, etc. The Win outcome also includes instances when the sales goal was successfully achieved, such as the sale of products and or services.
We removed irrelevant variables, outliers and data with missing values from the initial data set. We also computed new variables (e.g., Average number of calls, Salesperson experience, etc.) from several data fields. After preprocessing, our final sample includes 130 million interactions from about 45 million leads. We selected 20 variables that can be used to conceptualize salesperson effort (i.e., Average number of calls, contact attempts, time to lead, call time, sales cycle length and call duration), salesperson experience and outcome (i.e., unknown, loss or win).
Descriptive Modelling: We carried out the following descriptive analyses to understand best lead engagement practices.
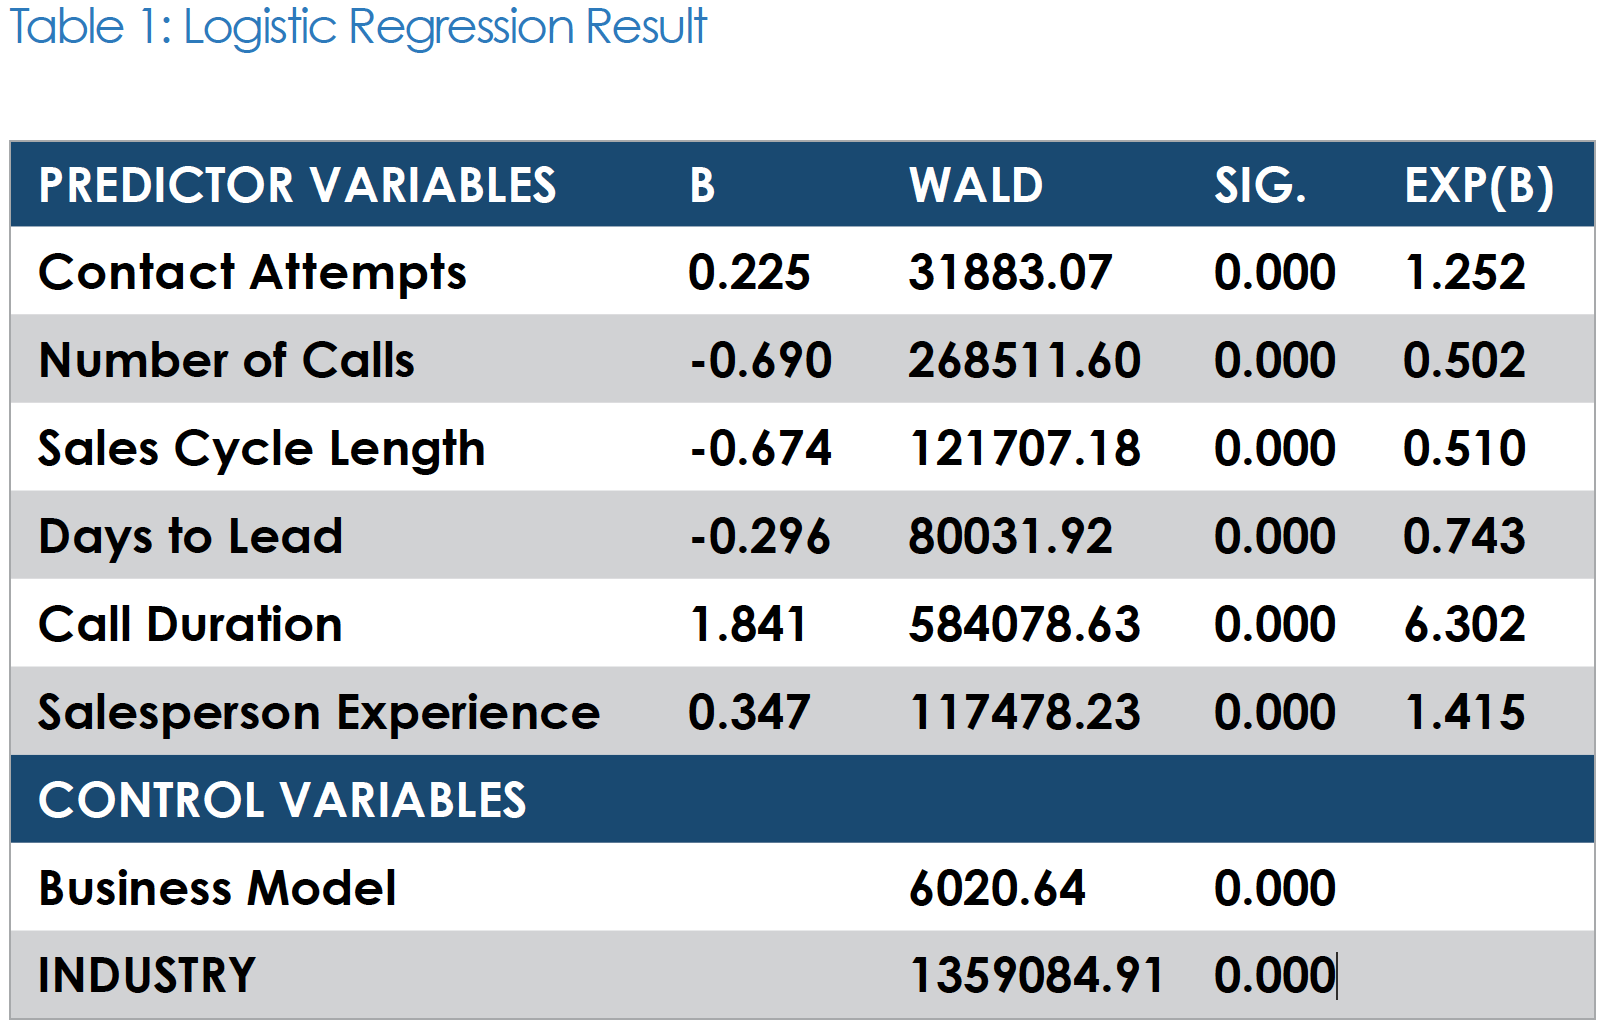
Predictive Modelling: We selected 6 predictor variables (i.e., call duration, contact attempts, days to lead, sales cycle length, number of calls and salesperson experience), 2 control variables (i.e., industry and business model) and 1 outcome variable (i.e., success) as input to the model. We applied logistic regression to gain a better understanding of the influence, significance and predictability of variables in the model. The result of our regression model is presented in Table 1.
The regression model is statistically significant. The model explained 46.7% of the variance in success (Pseudo R2 = 0.467). The classification accuracy of interactions was 80.6%. Wald Chi-square statistics reveal that all the predictor variables had statistical significant influence on success in the model (Chi square = 85357.99, p < 0.0001). Overall, the model reveals that a longer wait time in days before making first contact with a lead, a longer sales cycle length and higher number of calls were associated with a reduction in the likelihood of success. While an increase in call duration, contact persistency, and salesperson experience increases the likelihood of success.
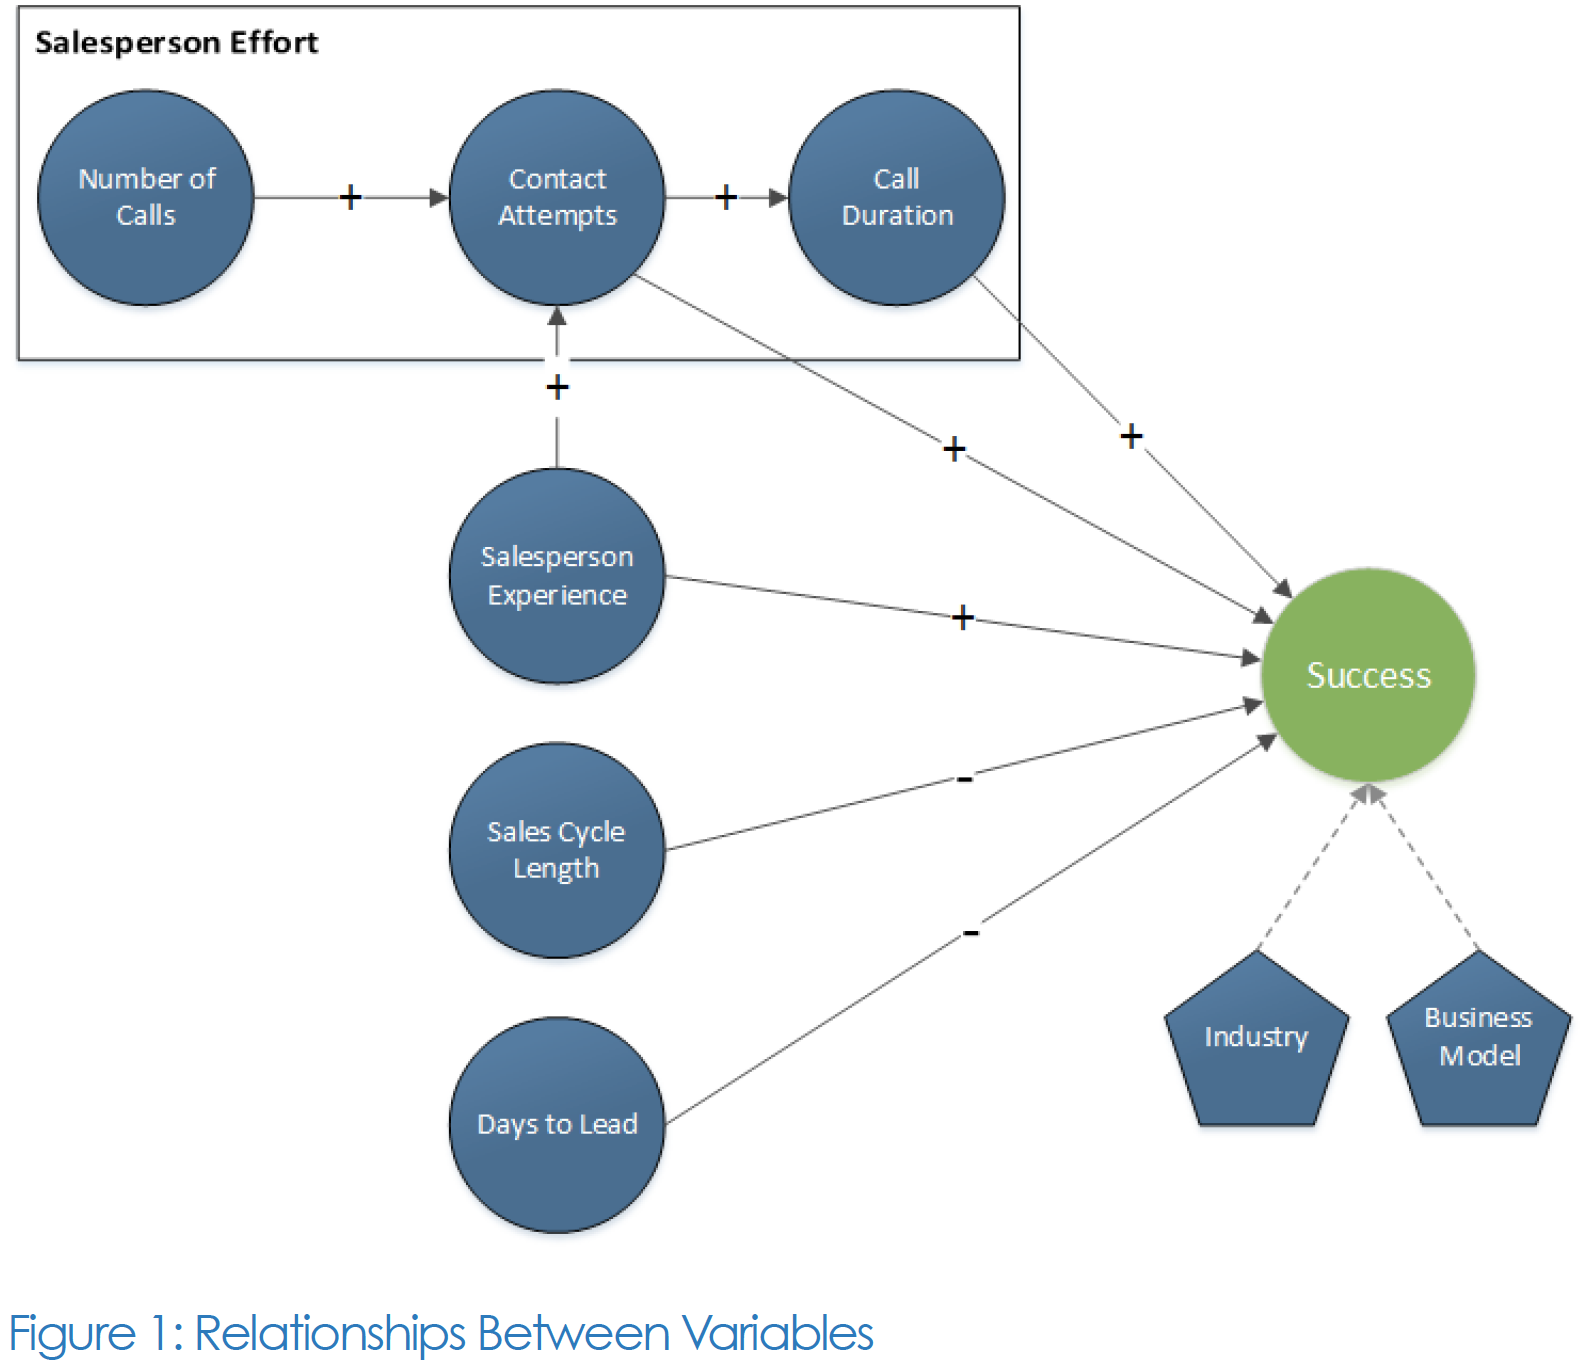
In Figure 1, we provide a visual representation of the relationships between all variables. Please note that this is an initial model that will change as we input more variables. The positive and negative signs indicate the direction of influence of variable relationships.
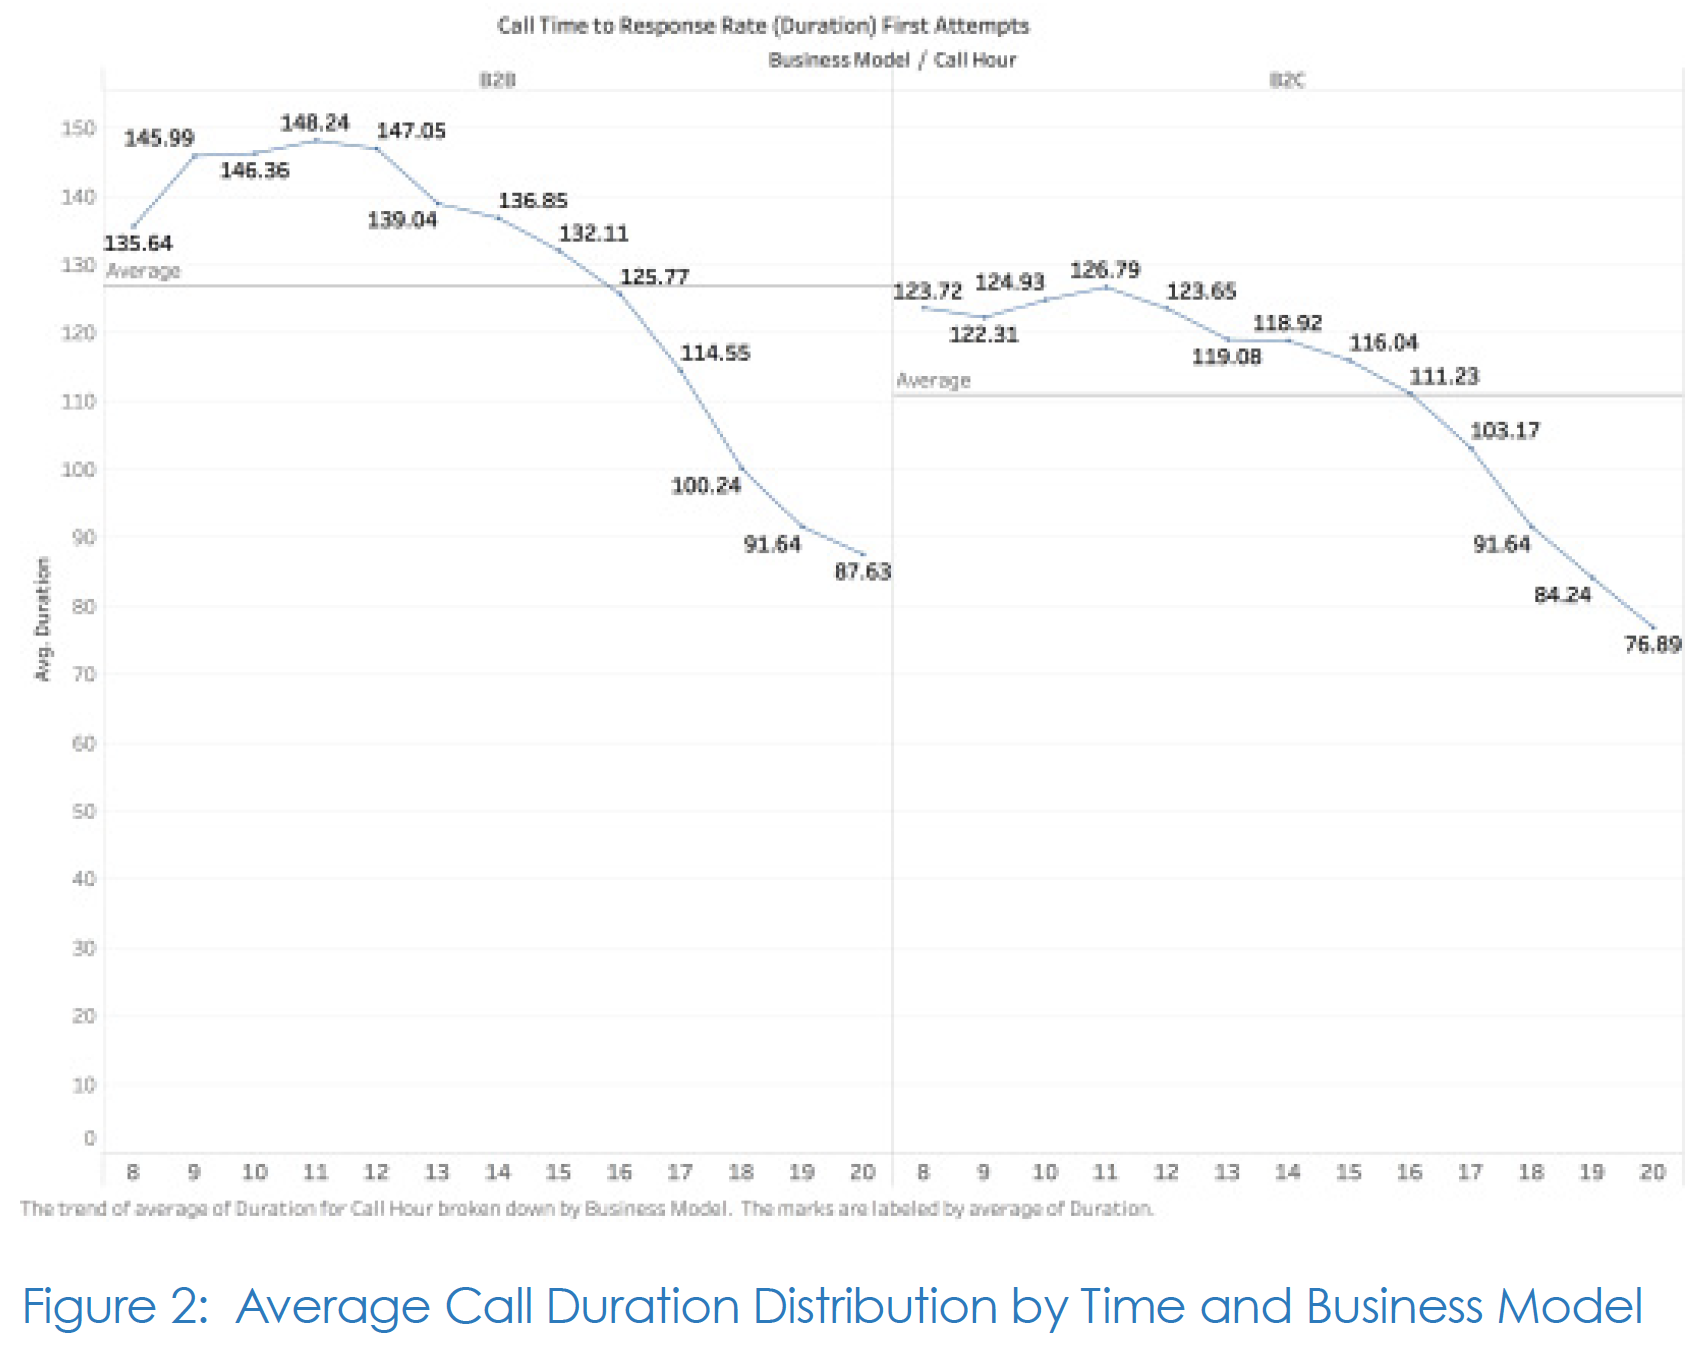
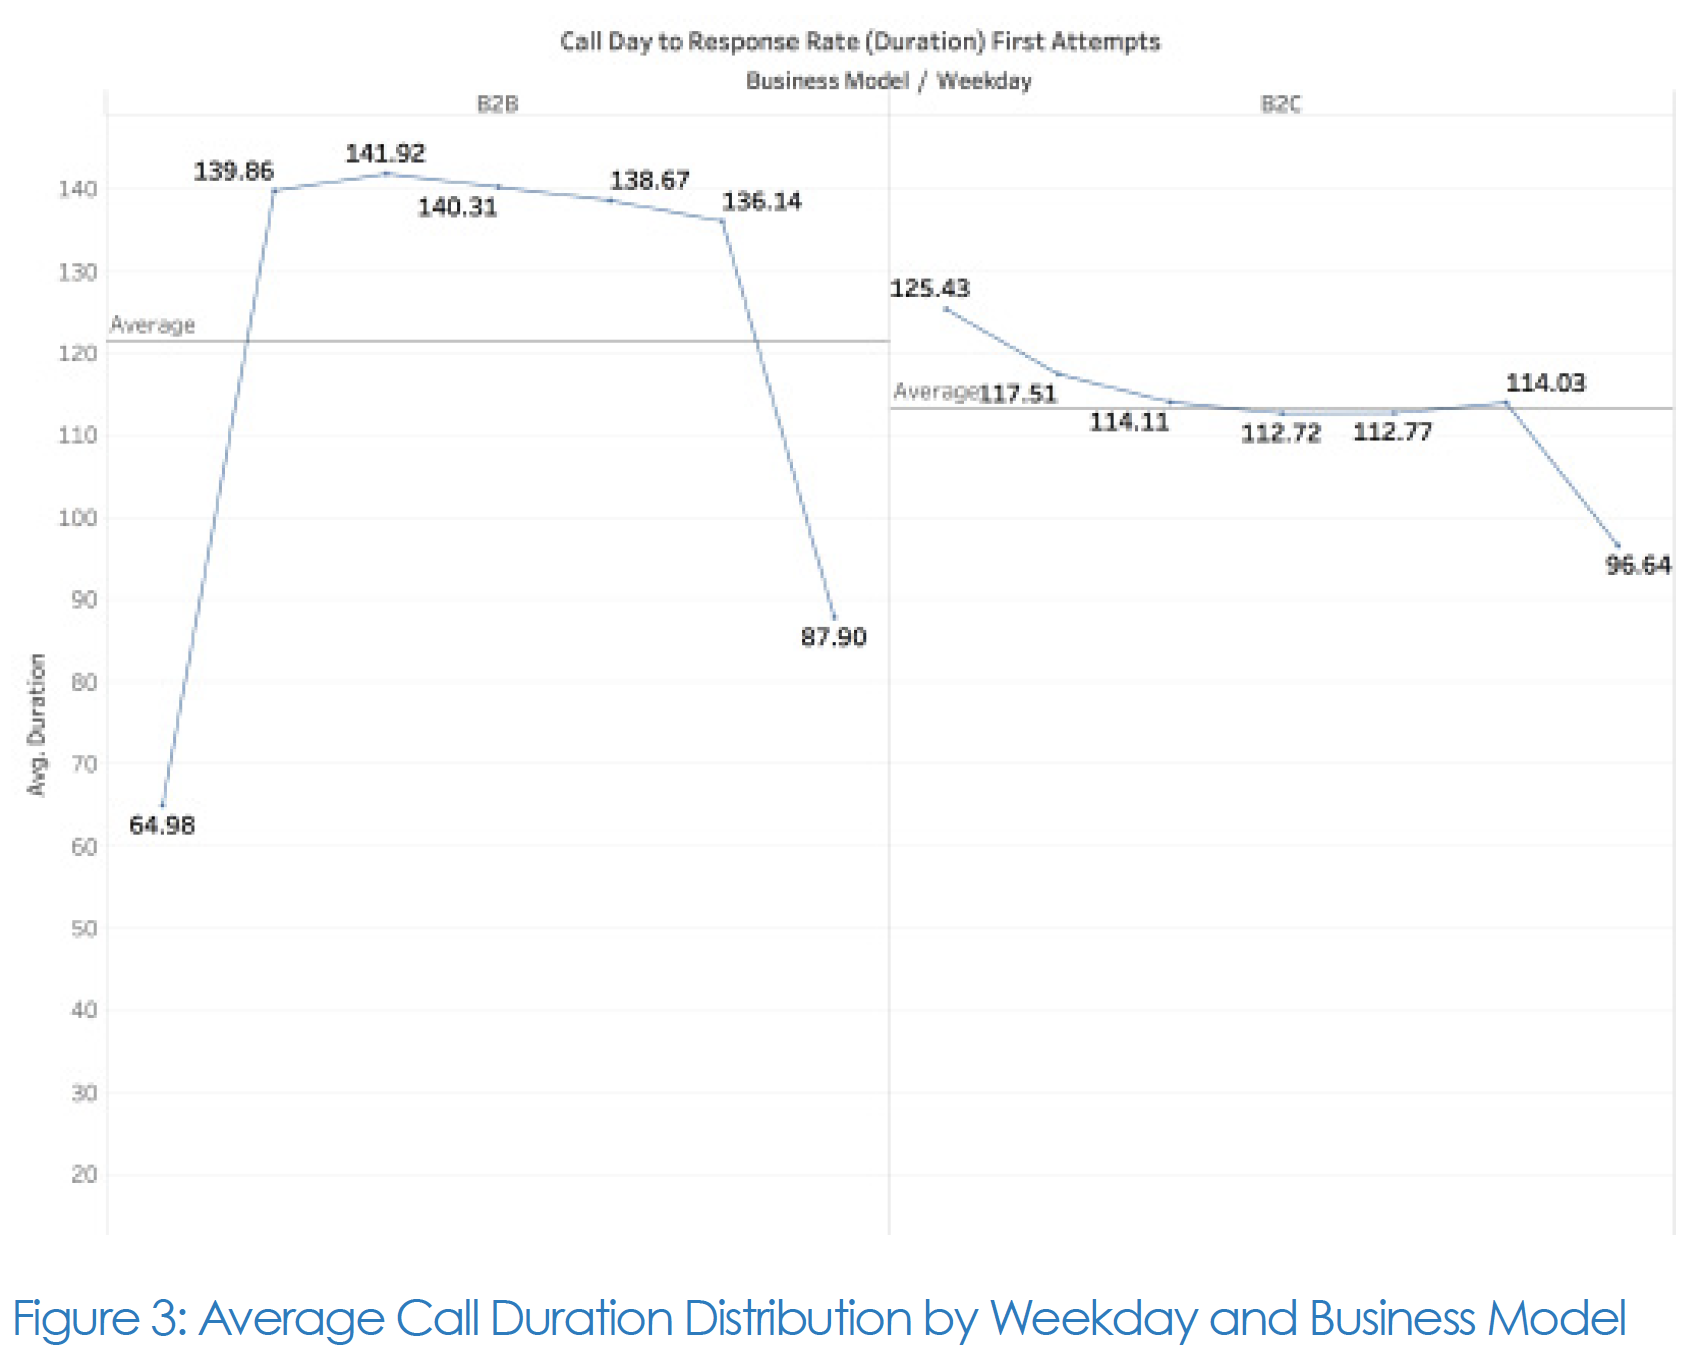
When exploring the best time to reach a lead, we seek out days and times with higher response rates from leads. Our approach on this investigation is different from that of the industry (e.g., Elkington & Oldroyd, 2016) where they try to seek out the best day and time to call to qualify or convert leads. This is because we found that times with the highest win outcomes have a low proportion total calls made by salespeople. We believe that the best day and time to call, is that which has a high response rate from leads.
Here, we found that all business days (Monday to Friday) and business times (8 to 16GMT) have a similar response ratio from leads (see Figure 2 and 3). Therefore, the data does not indicate that resources should be concentrated on any particular time of the day.
Furthermore, our regression analysis found that duration was the most significant factor of success in our model. The model suggests that for every increase in minute in call duration, there is 6 times better odds of success with the lead. This makes sense because a higher call duration signifies a quality conversation, and a quality conversation is a key indicator for better engagement and ultimately success.
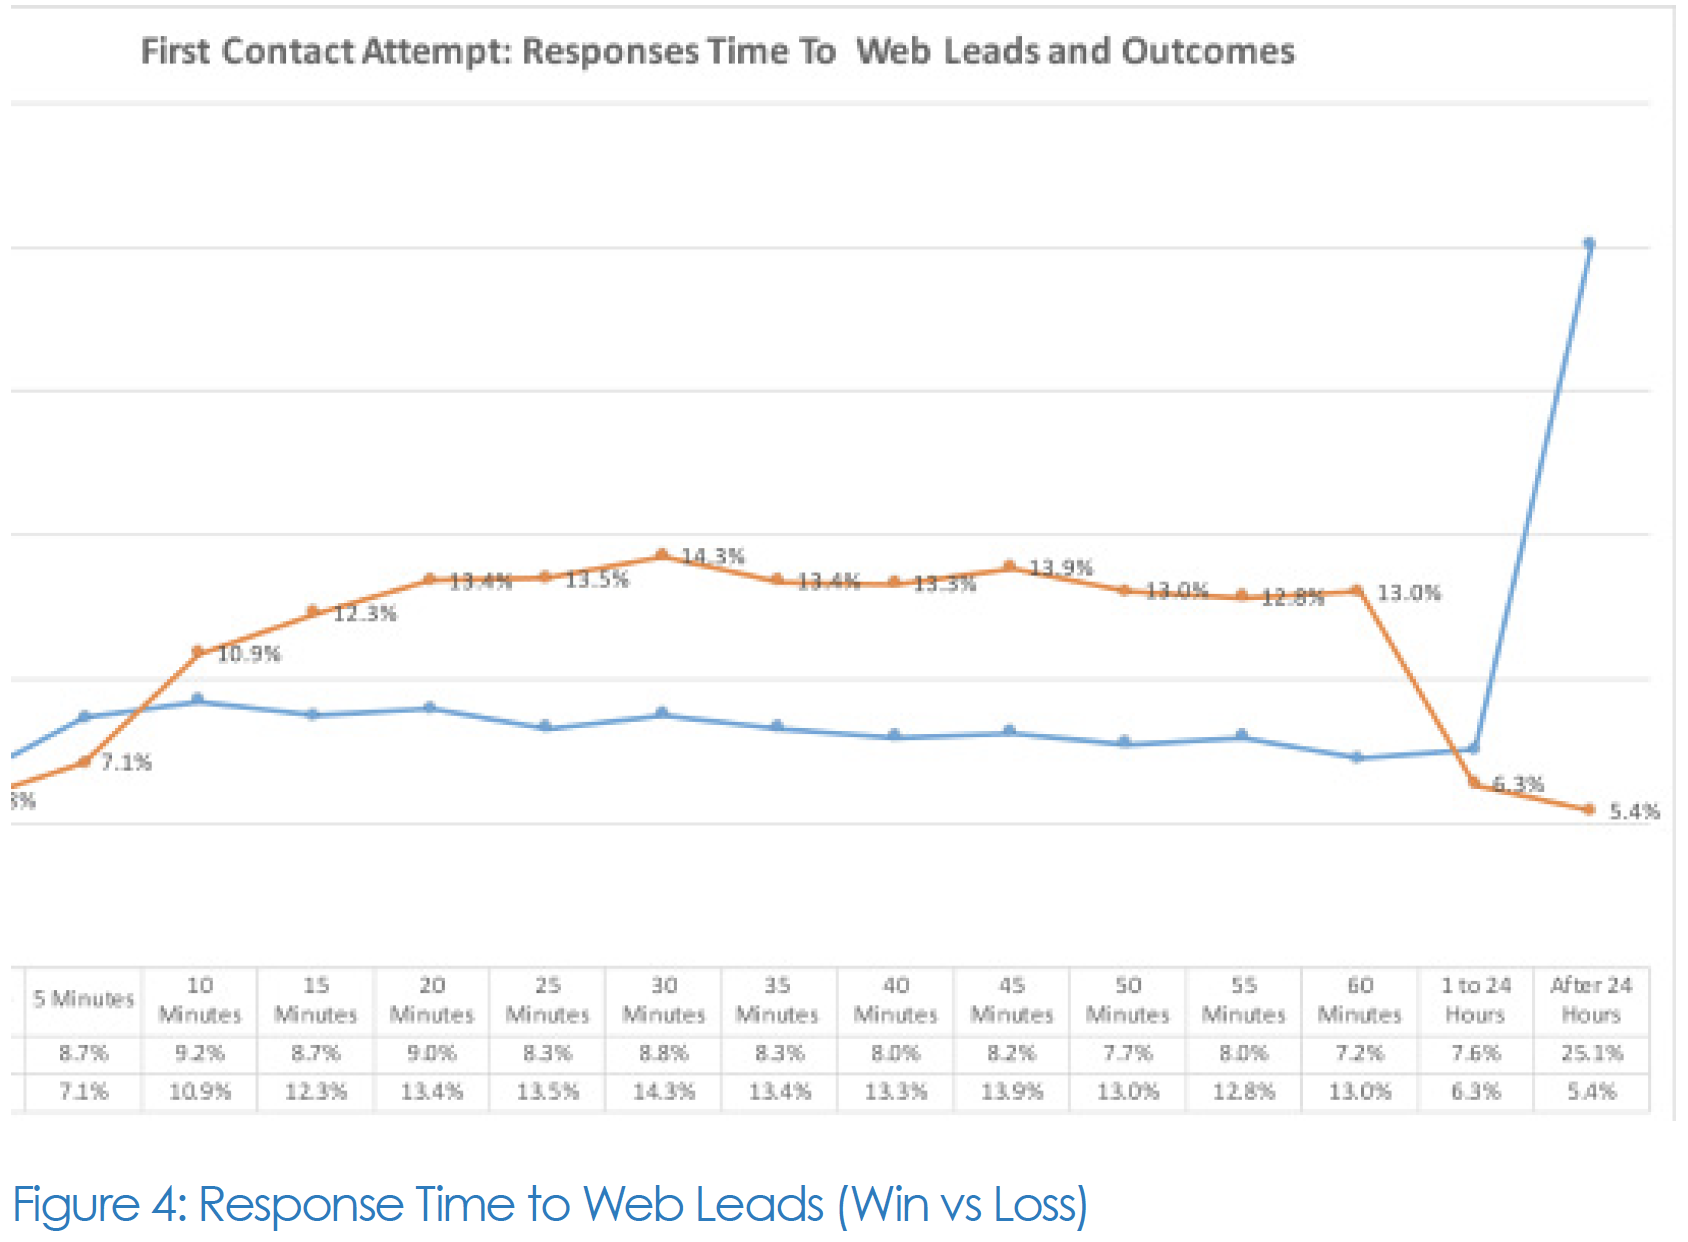
Current industry reports show that the odds of qualifying a web lead decrease by over 10 times in the first hour, and the best odds are if the first contact occurs within the first five minutes (Elkington & Oldroyd, 2016).
Interestingly, our findings somewhat contradict this common dogma. Figure 4 illustrates that the best odds for first contact with a lead are between 10 - 60 minutes of a query, and not the first 5 minutes. While, it is uncertain why contact momentum picks up only after the first 10 minutes, we plan to investigate this further. However, consistent with industry reports, we found that contacting a web lead within the first hour is very important to increasing the chances of success.
Smith et al., (2006) suggested that leads contacted within the first 5 days of being identified have a 20% better chance of purchase than those contacted later. Similarly, our regression model shows that delays in making the first contact to leads (both web leads and non-web leads), and a longer sales cycle length were associated with a reduction in the likelihood of success. It makes sense that when salespeople delay their first and subsequent contact with leads, there is a chance that the lead may have been lost to a competitor or may have lost interest in the product or service offering.
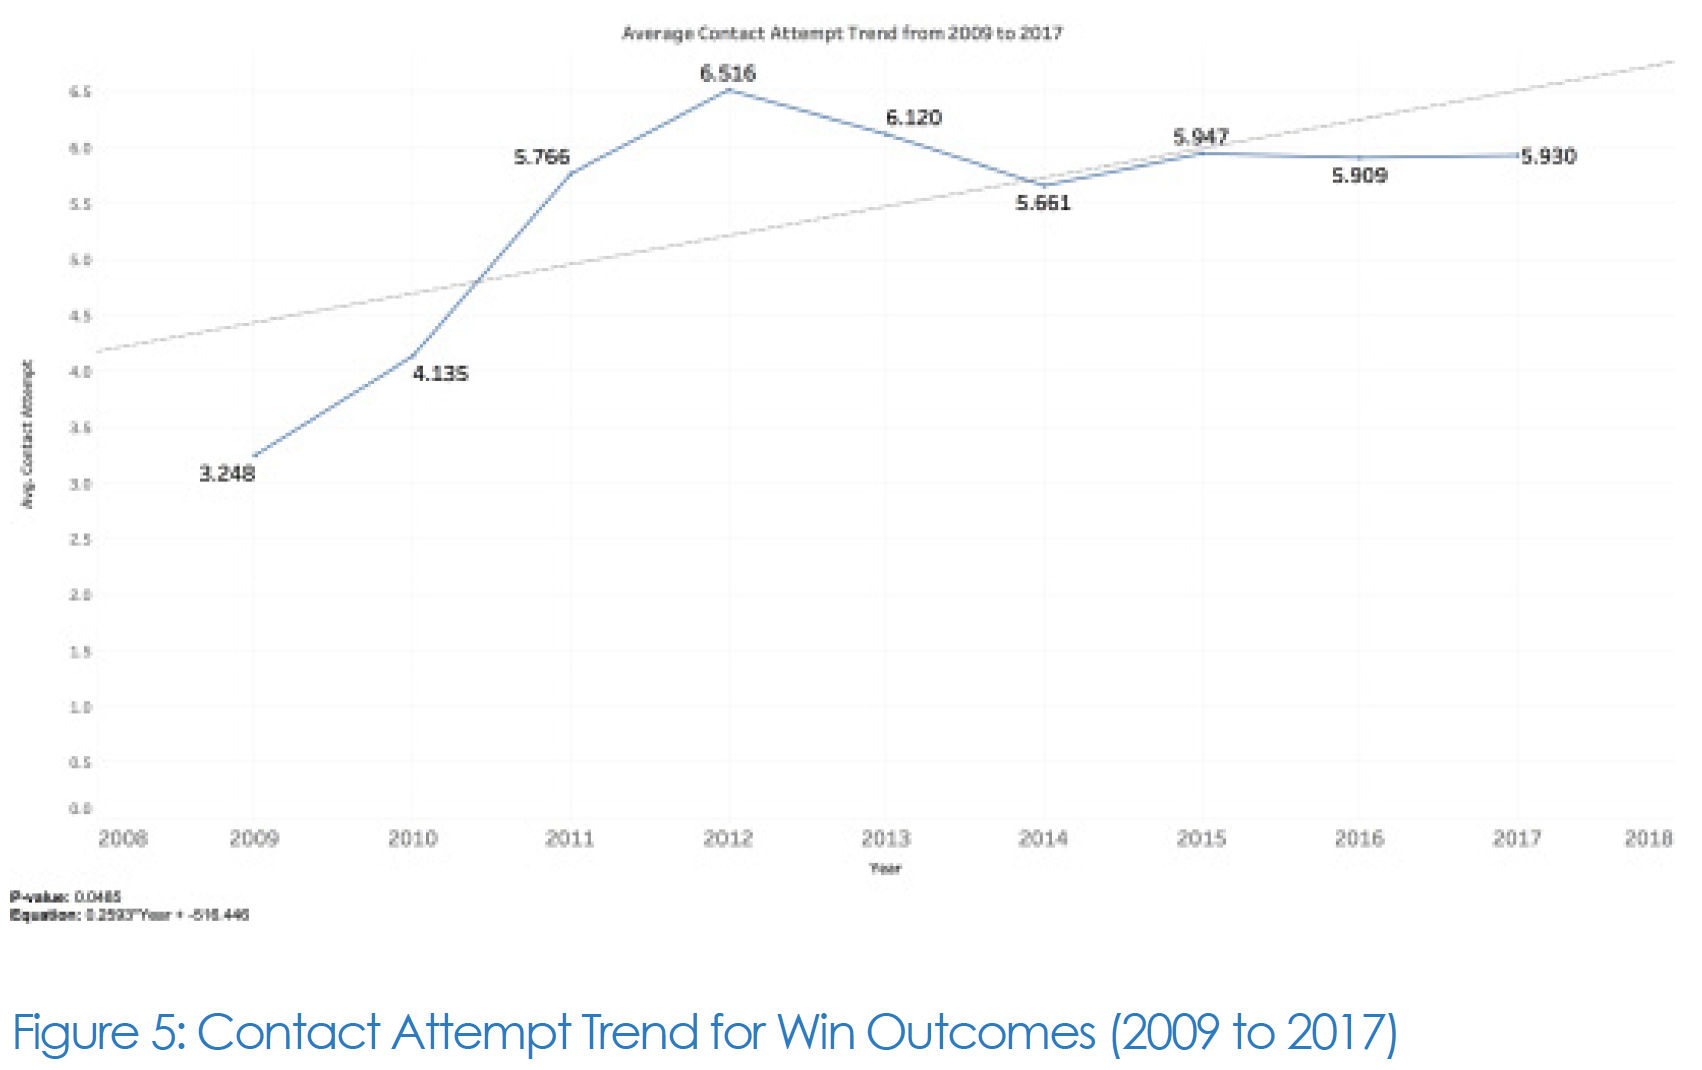
Existing reports indicate that 10% of sales are closed after 4 follow-up contacts and 80% of sales are closed between 5 and 12 follow-up contacts (Elkington & Oldroyd, 2016; Haliva, 2015). Our findings were consistent with the published averages. Overall, we found that the average number of contact attempts needed for a positive outcome with a lead is 5.7 for B2B companies and 5.9 for B2C companies.
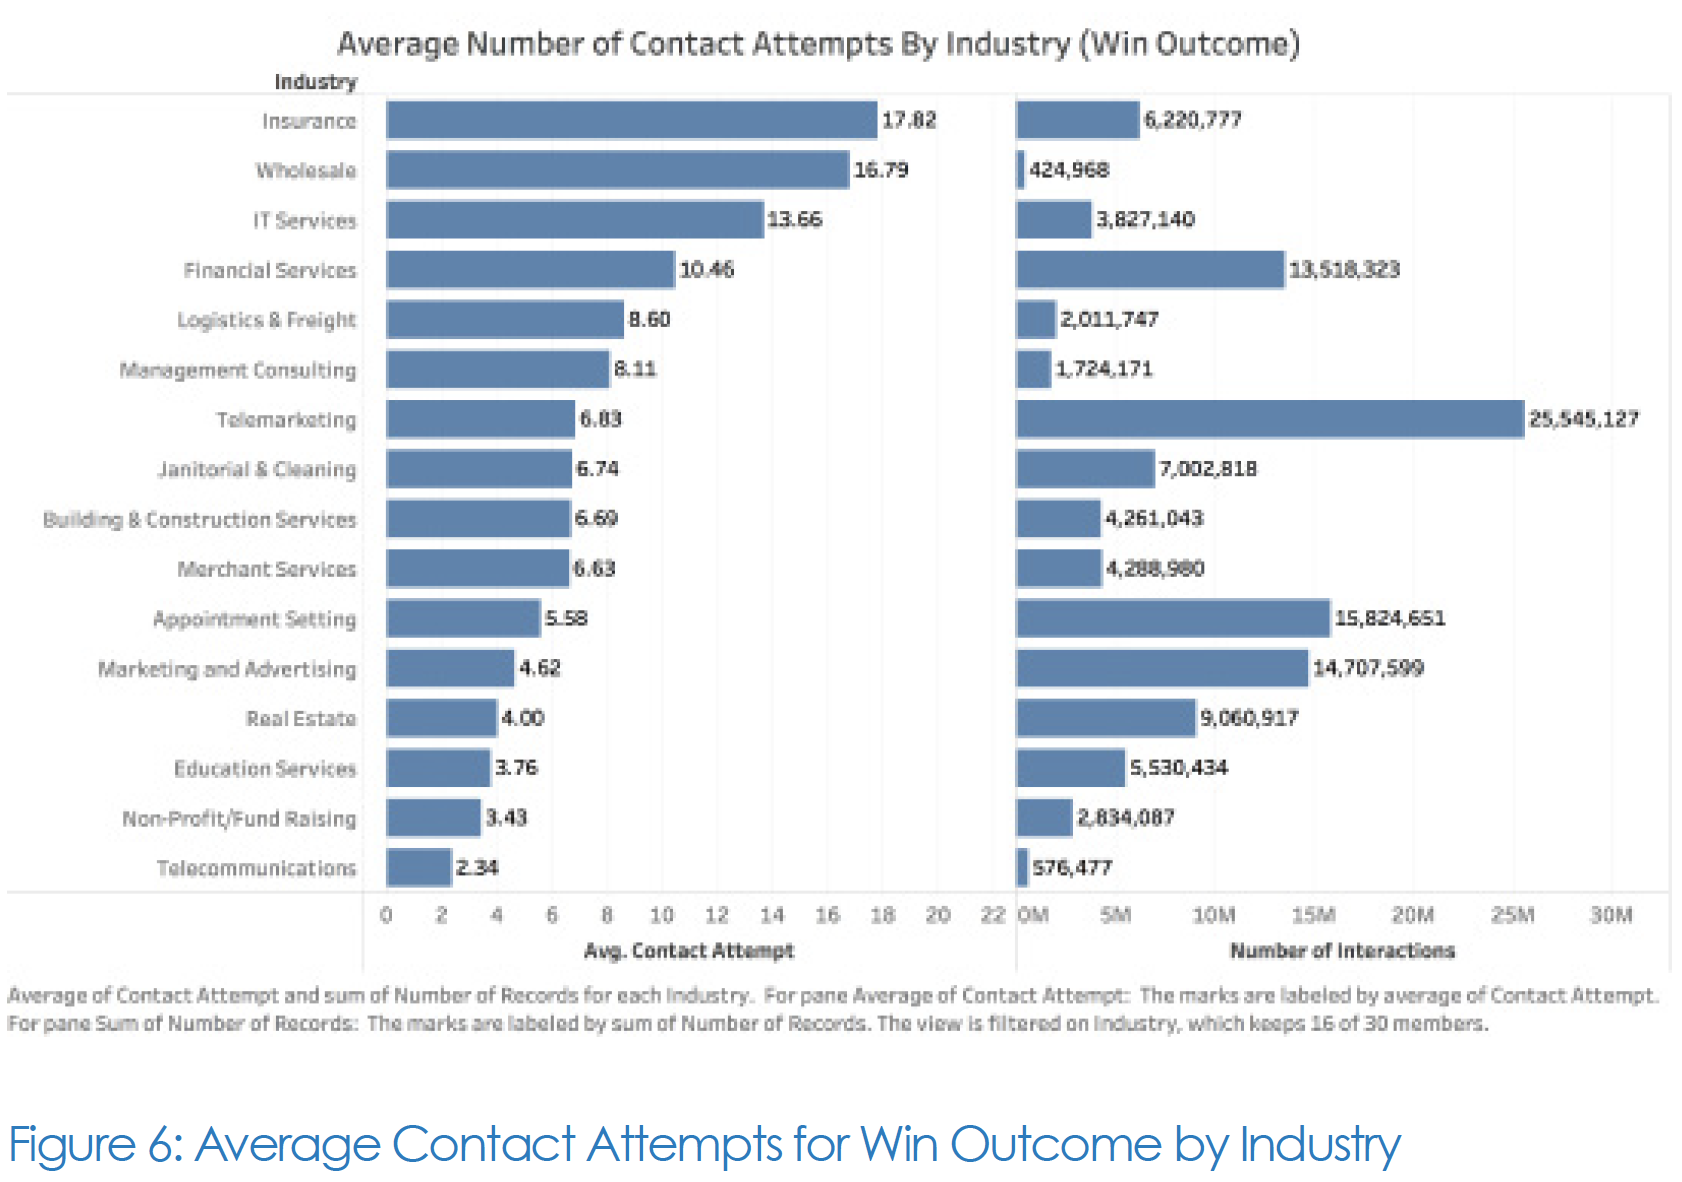
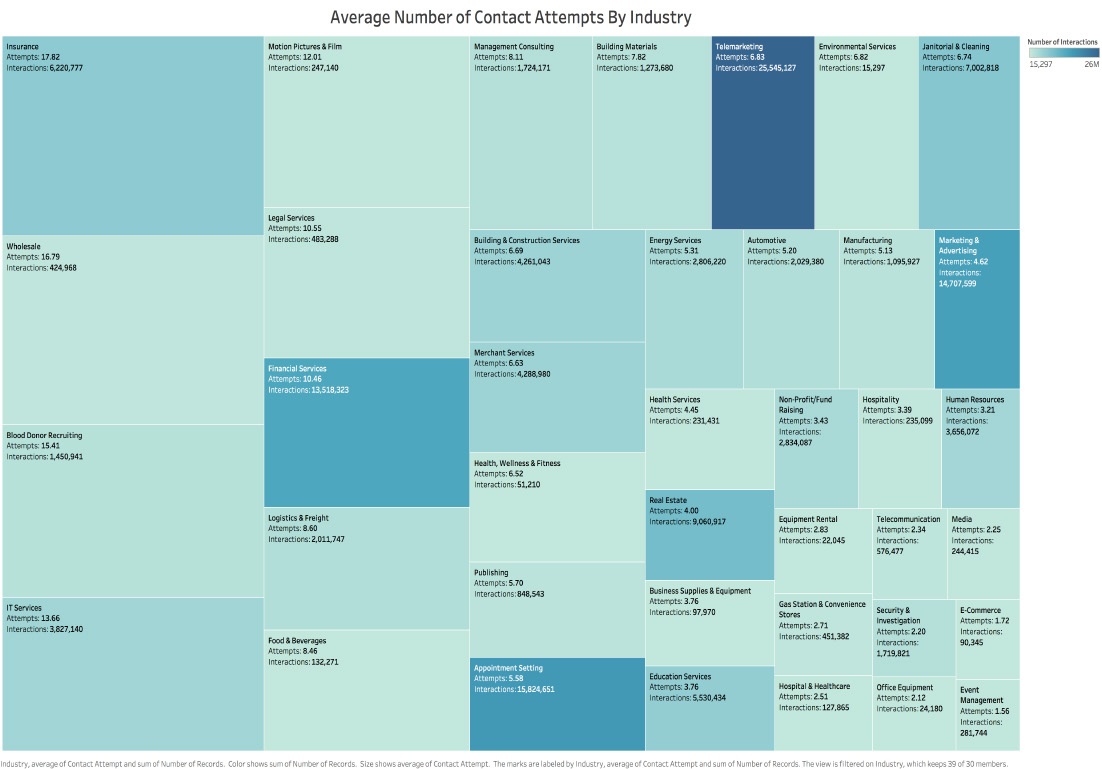
Our analysis shows a trend of an increased number of contact attempts needed to win a lead (see Figure 5). Additionally, we also found that the contact attempts needed for a win outcome vary from industry to industry. Companies in service-oriented industries or wholesale need to make more contact attempts than companies in other industries (see Figure 6).
Note that we limit the number of industries in Figure 6 for better visualization. Moreover, we provide an industry benchmark of average contact attempts for all outcomes (see Figure 8).
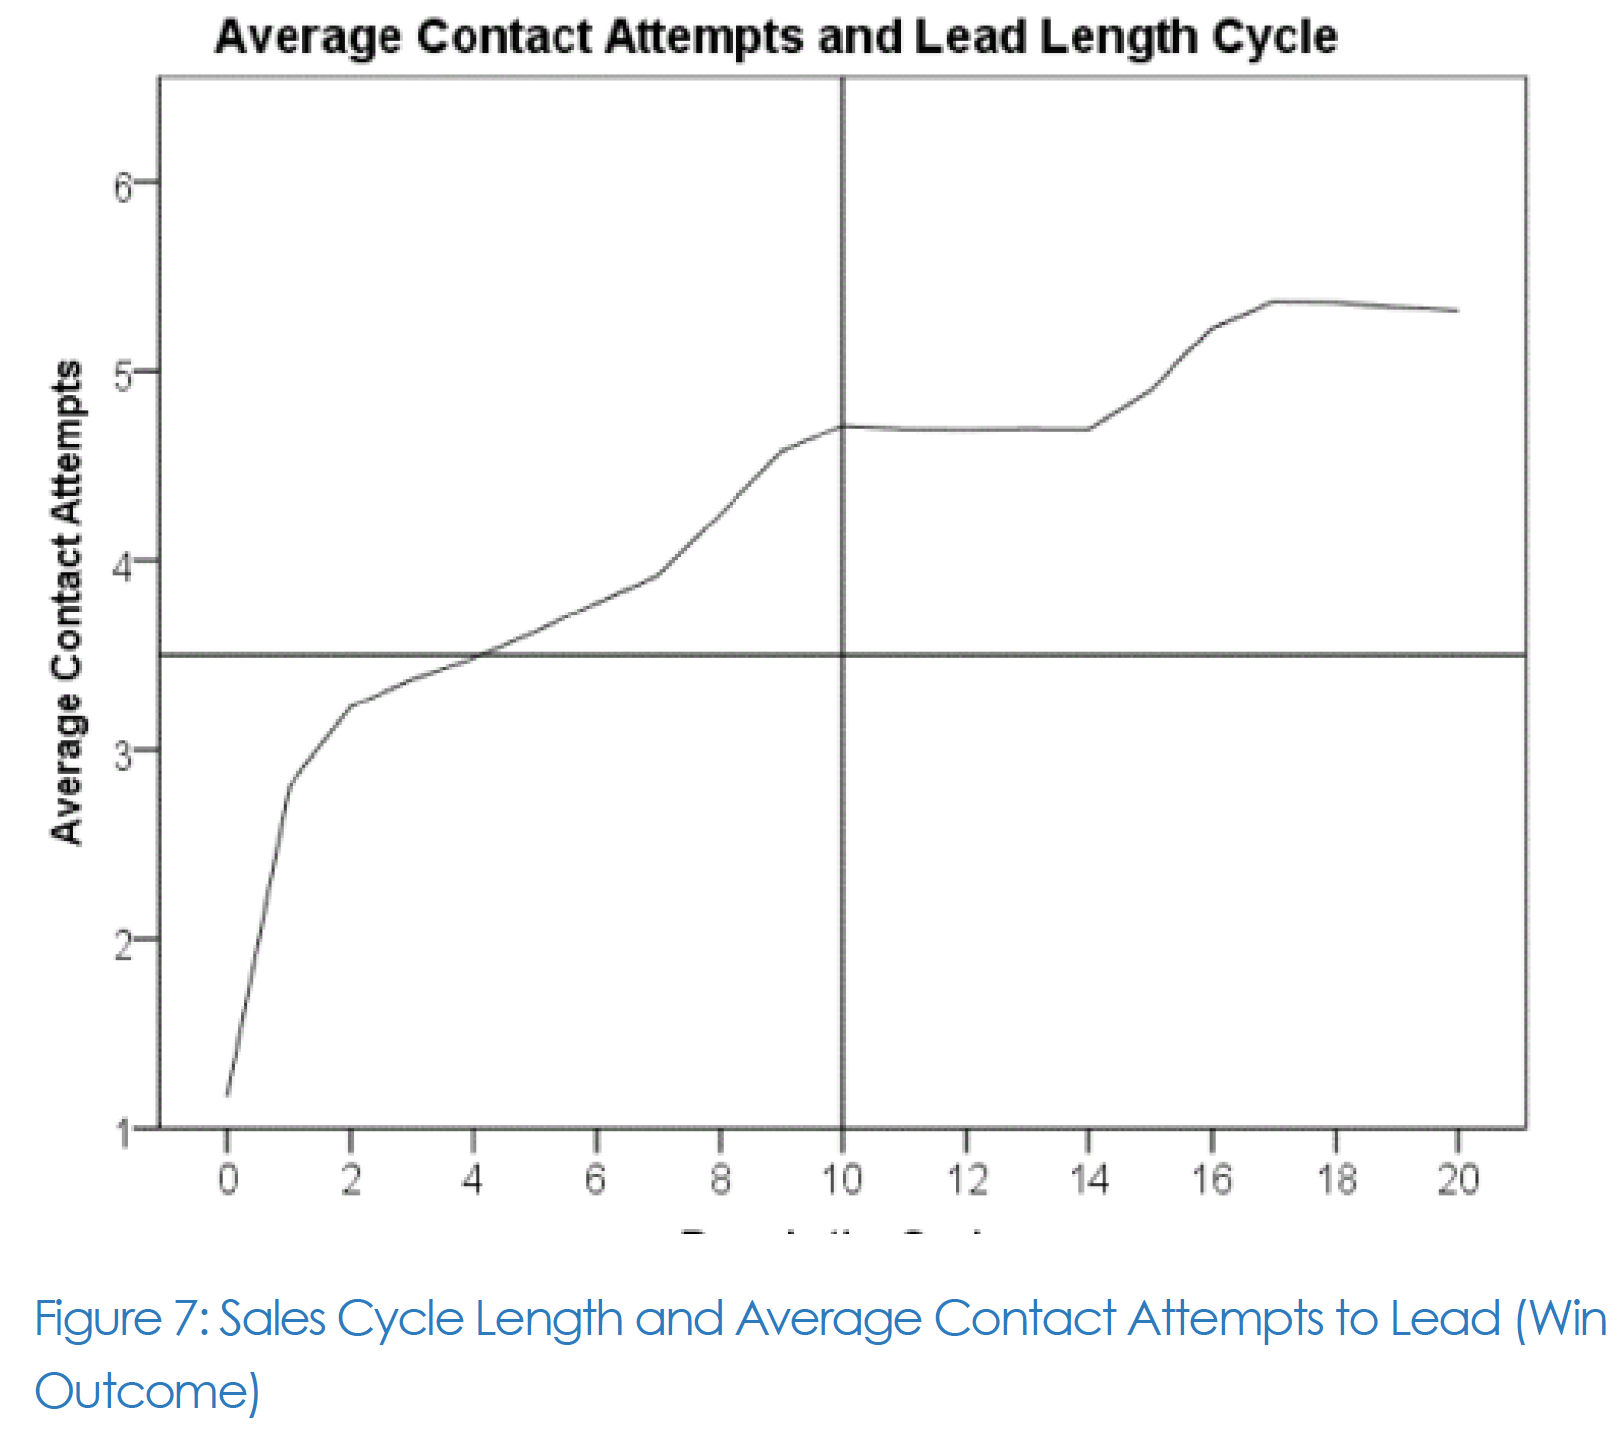
Importantly, we found a trend in tactically spacing contact attempts. The majority of leads won have an average of 3 to 4 contact attempts made within the first 4 to 5 days of a lead being in the sales cycle (see Figure 7). Afterwards, contact attempts are widely spaced for another 5 days. Accordingly, we encourage inside sales practitioners to put more effort towards responding quicker to all leads with a more persistent follow-up at the beginning of the lead cycle.
Number of calls is a key indicator of a salesperson’s performance as perceived by practitioners and justified by academia (Ahearne, Jones, Rapp, & Mathieu, 2008; Zallocco, Pullins, & Mallin, 2009). In a previous investigation using survey data collected from sales professionals, we found no direct statistical relationship between the number of calls and a salesperson`s performance. Interestingly, our current regression model reveals that an increase in the number of calls is associated with a decrease in the likelihood of success.
However, an increase in number of calls is associated with an increase in contact attempts, which in turn increases the chances of success. This implies that the impact of call productivity on success is not direct, but rather through contact attempts. For instance, a salesperson that makes a call that counts towards more contact attempts with a particular lead, will likely be more successful than a salesperson making single attempts to multiple leads. The best performers make between 50 to 60 strategic calls daily that count towards persistency, speedy engagement and improved response rate.
The measure of experience we used captures the least amount of time a salesperson has spent working with the current company and in the current territory. The regression model shows that salespeople with more experience will win more leads than less experienced salespeople. Repeated practices enable salespeople to align their experience to effectively engage with leads. In addition, a correlation analysis shows that experienced salespeople make fewer calls but engage with more persistency, with speed and can sustain quality conversations with leads.
I am extremely impressed with how easy it was to get started and train my marketers on the VanillaSoft solution. As well, I had a lot of flexibilityon how I wanted this program to run for our company. Plus, customer service is EXCELLENT at VanillaSoft. I highly recommend VanillaSoft to anyone!

Jody Weinberg J Telecommunications
We have never been so successful. Since we started using VanillaSoft we have increased productivity by 175%! Also, working with the VanillaSoft team has been an incredible experience. They helped us customized our campaigns and page layout to fit our unique needs.
.png)
Lauren E. Siegel Michigan Hillel